
For the purpose of this blog entry, we intend to document how to install and use Xdebug to profile an application and how to install and use Webgrind to view the data produced by Xdebug to identify bottle-necks in the code. I realize that this blog article is more technical than normal, but I’m hoping by documenting this, the entire community will benefit. I’ll also note that you do not have to be a developer to help the community document and expose performance issues. If you have a performance issue, you can help us out by profiling the code in your environment to help give the FreePBX team a clue about where the performance issue may be located within the application.
Xdebug is an extension for PHP to assist with debugging and development. Xdebug contains several tools that can assist with debugging PHP applications. It contains a single step debugger to use with IDEs such as Visual Studio Code, Webstorm, or even VIM. Xdebug can allow the developer to monitor the stack traces for Notices, Warnings, Errors and Exceptions. Finally, Xdebug provides a profiler which outputs profiling information in a format called kcachegrind, which is what we’re interested in today.
Webgrind is an Xdebug profiling web frontend in PHP. It implements a subset of the features of kcachegrind, installs in seconds, and works on all platforms. Webgrind allows the developer to visualize and find bottlenecks in the code.
From the combination of the usage of Xdebug and Webgrind, we’ve been able to locate and fix bottlenecks in the FreePBX code, which has resulted in a speedup of up to 10 times faster in certain situations. This has decreased certain page load speeds from minutes to seconds. Pretty cool huh?
Installation
To get started, let’s show you how to install these tools on your FreePBX 15 distro also known as SNG7. I’ll note that performance debugging can be done on other platforms as well, but these instructions may not follow exactly what needs to be done.
WARNING: It is not recommended to install Xdebug and Webgrind on a production FreePBX System. Simply having Xdebug enabled on a system can actually result in slower performance. It is recommended to take a backup of your production machine and restore it to a second machine to run any performance testing.
Install Xdebug
First install xdebug:
yum install php56w-pecl-xdebug.x86_64
Use your favorite editor to edit /etc/php.d/xdebug.ini:
nano /etc/php.d/xdebug.ini
Make sure the new xdebug.ini includes the following:
; Enable xdebug extension module
zend_extension=/usr/lib64/php/modules/xdebug.so
xdebug.profiler_enable = 0
xdebug.profiler_enable_trigger = 1
xdebug.profiler_output_name = xdebug.out.%t
xdebug.profiler_output_dir = /var/spool/asterisk/tmp/
Finally restart apache:
service httpd restart
Let’s briefly go over the Xdebug settings:
xdebug.profiler_enable = 0
This disables Xdebug profiling by default. Please be aware that enabling profiling significantly increases the execution time and resources required for each script to run. This is mainly due to the fact that every single function executed is being recorded to a log file. Enabling profiling for the entire system will result in the operating system being overwhelmed and eventually will become non-responsive.
xdebug.profiler_enable_trigger = 1
Instead of enabling profiling globally, we recommend that you trigger when Xdebug profiling should be enabled. Enabling this option allows us to selectively enable the profiler by using a GET/POST or COOKIE variable of the name XDEBUG_PROFILE and a value of 1. This allows us to select which scripts we want the system to profile and won’t overwhelm the system.
xdebug.profiler_output_name = xdebug.out.%t
This option determines the name of the xdebug profiling file. The %t here represents a timestamp. So an example file name here will be: xdebug.out.1596468035
xdebug.profiler_output_dir = /var/spool/asterisk/tmp/
This option allows for us to specify the profiler output directory. We have chosen /var/spool/asterisk/tmp/ here instead of /tmp, because PHP handles /tmp differently between scripts and we want to make sure that when we’re profiling, any profiling output generated is made available to Webgrind. See: https://www.the-art-of-web.com/php/where-is-tmp/
For more information on all of the settings available for Xdebug, check out the documentation here: https://xdebug.org/docs/all_settings
Install Webgrind
We will install Webgrind as an application that lives within the main FreePBX application.
First, we need to make sure that we have the git application installed so we can download Webgrind from their github repository:
yum install git
Download Webgrind from their github repository:
cd /var/www/html
git clone git@github.com:jokkedk/webgrind.git
To enable graphing I had to install graphviz via yum:
yum install python3 graphviz
Python3 is not linked by default so, let’s do this now:
ln -s /usr/bin/python3.6 /usr/bin/python3
That’s it!
Performance Testing
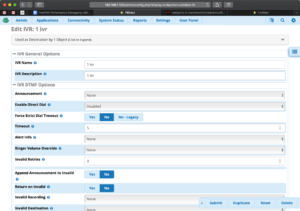
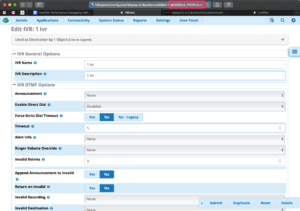
To start the performance testing, navigate to the page that is performing slowly. In this example case, we noticed that the IVR edit page is running slowly. So we navigate to http://192.168.1.125/admin/config.php?display=ivr&action=edit&id=15
In this example, 192.168.1.125 is the IP address of our server. To test the IVR page on your own system, you would change this ip address to the corresponding IP address or hostname of your FreePBX instance.
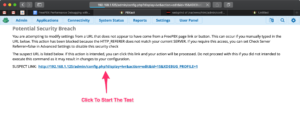
To enable Xdebug profiling, we simply add `&XDEBUG_PROFILE=1` to the end of the URL to make it: http://192.168.1.125/admin/config.php?display=ivr&action=edit&id=15&XDEBUG_PROFILE=1
After navigating to this new URL, FreePBX may warn of a potential security breach. This is expected, because we changed the URL in a way FreePBX didn’t expect. Simply click on the link to start the test.
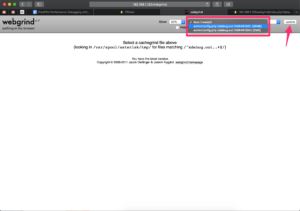
When the page has finished loading, Xdebug should have profiled the application. Now you can navigate to Webgrind to see the results. Example: http://192.168.1.125/webgrind/
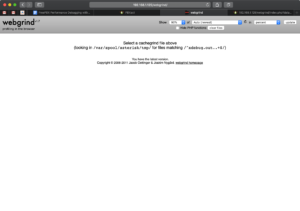
Select the results you wish to see from the drop down menu at the top of the page and press ‘update’. The results are listed in order, so more than likely you need to select the first option in the menu. Note: It sometimes takes Webgrind a lot of time to process through the results.
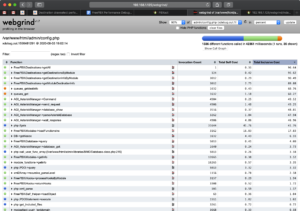
Once processed, Webgrind will show the results broken down by Invocation Count, Total Self Cost, and Total Inclusive Cost
Reading Webgrind Results
Webgrind breaks down each function in the application by Innovation Count, Total Self Cost, and Total Inclusive Cost.
Invocation Count: The number of times the function has been called
Total Self Cost: The total time it took to execute the raw php in this function (time taken to execute your other custom functions is excluded.)
Total Inclusive Cost: Total time, including any other functions called (PHP internal, or your functions)
I recommend sorting the results by Total Inclusive Cost. This tends to show the functions that are taking the most time to complete.
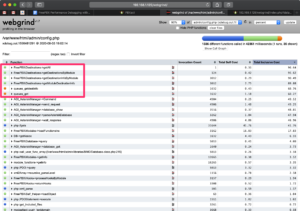
For our example, you can see that the following functions are the most costly:
- FreePBX\Destinations->getAll
- FreePBX\Destinations->getDestinationsByModule (Found in Framework module)
- FreePBX\Destinations->getDestinationInfoByModule (Found in Framework module)
- FreePBX\Destinations->getModuleDestinationInfo (Found in Framework module)
- queues_getdestinfo (Found in Queues module)
- queues_get (Found in Queues module)
A graph can also be created to show you a flowchart view of our functions and when they are executed. I’ve also identified the functions we found from the view above.
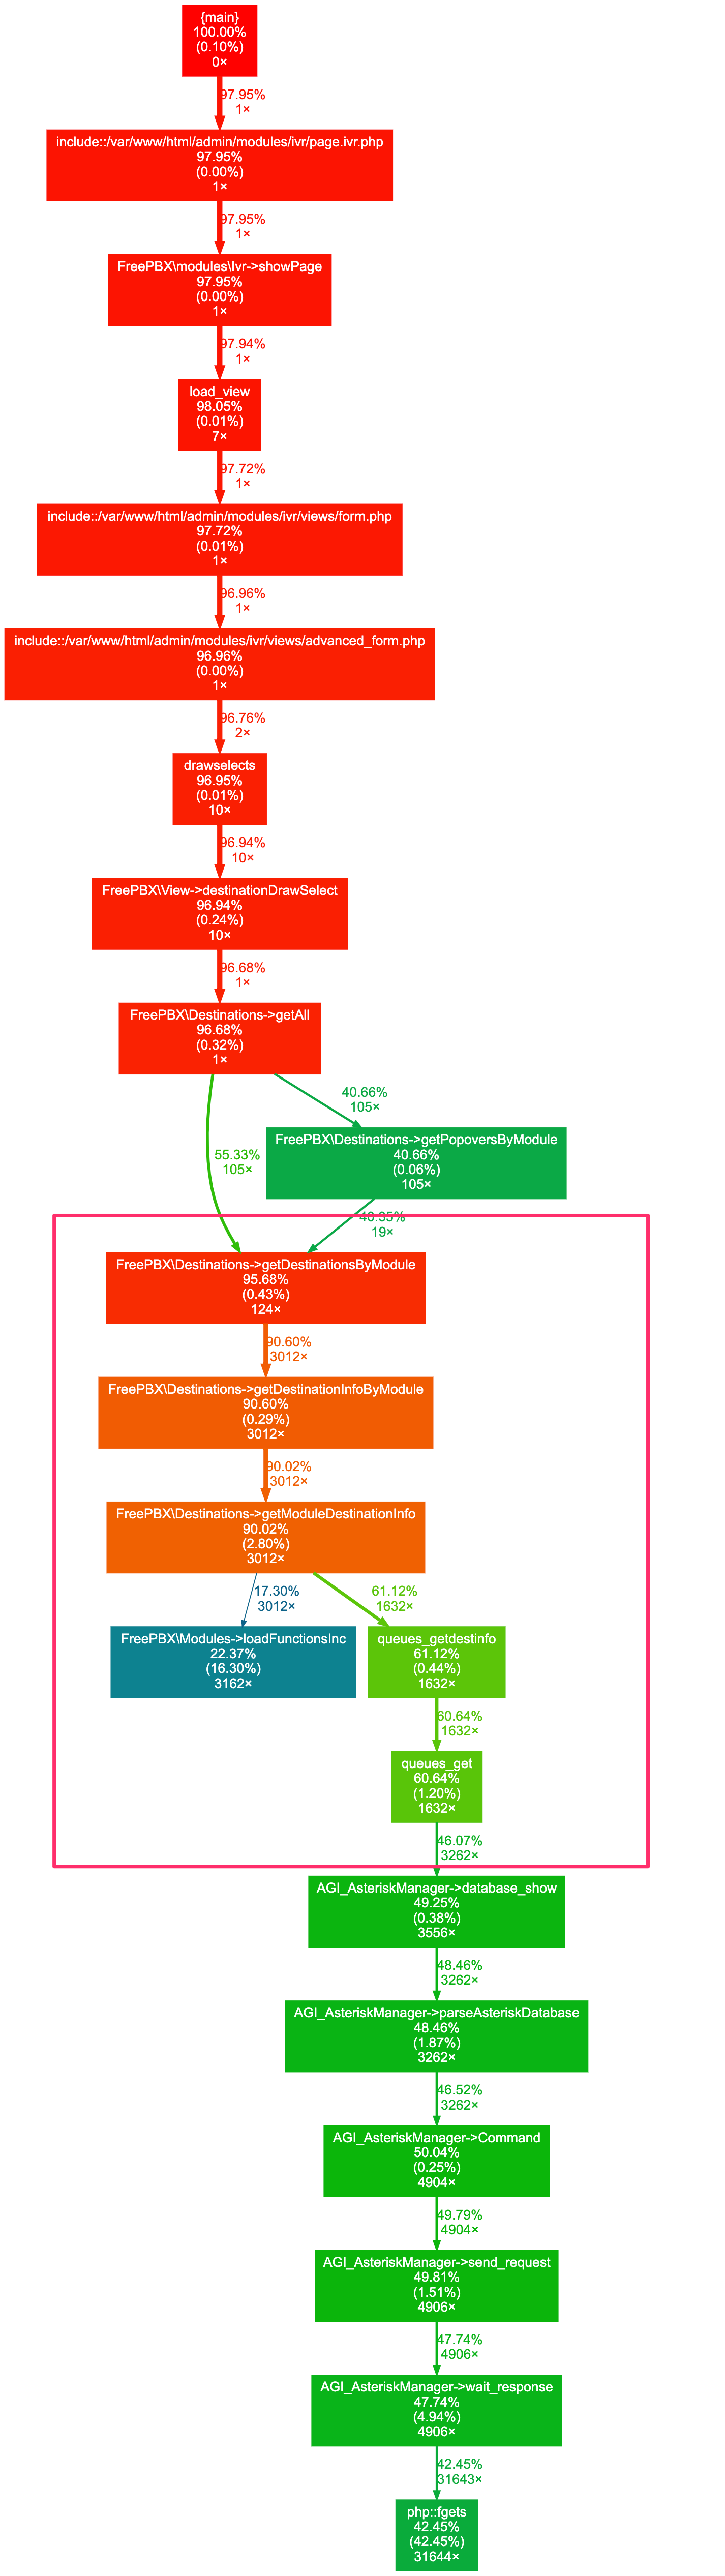
By looking at the results in Webgrind and reading the corresponding code in the Framework and Queue modules, we’re able to uncover a clue that the bottle-neck is happening in the queues_get() function found in the queues module. We can see that the queues_get() function calls out to Asterisk AGI several times, which I personally know is costly to execute. The code was also calling this for every queue extension in our database.
To fix this, we discovered that the queues_get() function was not providing us any information relative to what we needed, so we found a way to skip having to run it. This resulted in a significant decrease in page load time.
I won’t go into any more detail about the fix here, but If you wish to know more about the exact fix we put in place, you can checkout our commits to the Framework and Queue modules here:
Changes to Framework Module: https://git.freepbx.org/projects/FREEPBX/repos/framework/commits/0de08e9971cf9b8761a0bcdea43dc594fb7798e4
Change to Queues Module:
https://git.freepbx.org/projects/FREEPBX/repos/queues/commits/9b208cdcd7c4997d5face90c916d7cf52f023a03
Reporting Performance Issues
To report a performance issue with FreePBX, please run the performance testing steps as documented above and then create a Jira in the FreePBX issue tracker at https://issues.freepbx.org. Be sure to specify which module and page that is experiencing performance issues and attach the xdebug.out file from the performance tests as an include to the Jira. Although it is optional, it is helpful to run the performance out file through webgrind and create a screenshot of the call graph to make it easier for us to see visually where the bottleneck may be.
You do not need to be a developer to help the FreePBX project diagnose and report performance issues. We encourage anyone who is having a performance issue with FreePBX to reach out to us and let us know what you’re seeing and what you’re expecting. Giving us a profile of the code also lets us see technically what is happening which makes it easier to resolve your problem.
Happy Profiling!