
“Finally!”—that was my reaction. It’s what I’ve heard from friends and colleagues. And it’s probably what you’ll say once you see it in action.
If you’ve ever had to navigate or configure a dial plan—whether it’s on a system you know well or one you’re less familiar with—you understand the pain. It’s often time-consuming, confusing, and full of “what-ifs.” And it doesn’t matter if you’re just starting out or an experienced admin—beginners face a steep learning curve, while experts still run into hidden complexities. A clear visualization helps both.
Questions like these come up every time:
- Where does the dial plan start?
- Where does it end?
- Will changing this break something else?
- How many times do I have to test this?
- Am I missing a step?
I had the same frustrations—until I discovered an early version of a module called cpviz a few years back. It wasn’t perfect. In fact, it was pretty basic and only semi-functional. It stopped too early when navigating the dial plan and lacked many features.
But it planted a seed.
After tinkering, forking, and really digging into how it worked, I realized it could become something much more powerful. That “something” is what has now grown into the Dial Plan Vizualizer module you see today.
It still contains traces of the original code, but the bulk is new—rewritten, optimized, and extended to be genuinely useful for configuring, troubleshooting, and understanding complex dial plans.
Why Visualization Matters
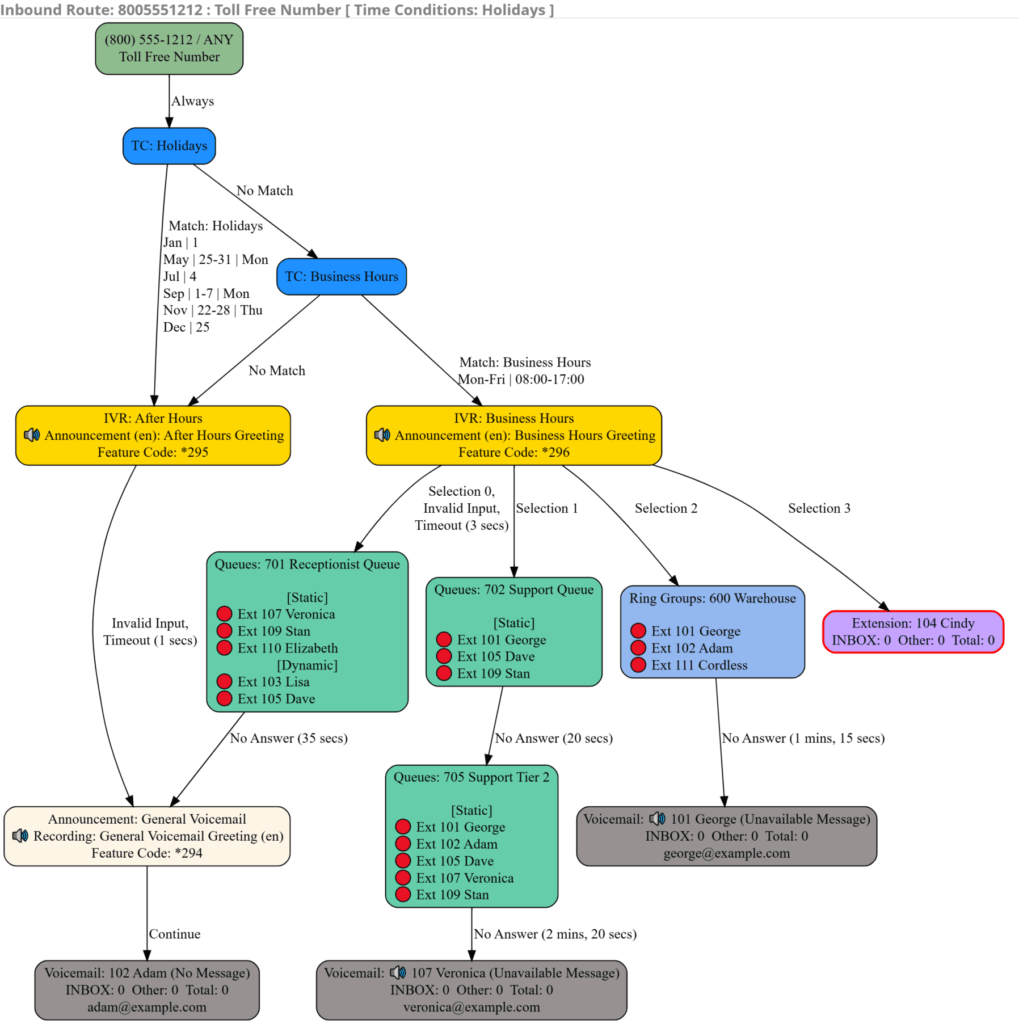
Dial plans are the backbone of any PBX system. But reading them in raw configuration form? That’s like trying to follow a road trip on a spreadsheet instead of a map. A good visualization bridges that gap. Instead of endless lines of configs, you see a living, breathing flow of how calls move through your system. That makes it faster to troubleshoot, easier to explain to others, and safer to make changes without fear of breaking something unseen.
Key Features
Here’s what the Dial Plan Visualizer brings to the table:
- Flexible Layouts: View your dial plan in vertical or horizontal mode.
- Pan / Zoom: Zoom in on details or pan out to see the bigger picture.
- Interactive Paths: Hover or click lines to highlight exactly where a call flows.
- Listen Along: Play back what a caller would hear—IVRs, announcements, voicemail greetings.
- Export Options: Save or share as .png or .svg.
- Path Highlighting: Click a node to highlight all previous paths.
- Start or Stop Anywhere:
- Start from a node: CTRL + Click to trim everything before it.
- Stop at a node: Shift + Click to halt the flow beyond that point.
- Save Views: Customize a view with CTRL/Shift clicks, then save it for later reference.
- Sanitize Labels: Share your dial plan safely online without exposing sensitive data.
- Multi-Language Support: Use the module in your preferred language—translations are available for several languages.
Extension Insights
See what’s happening, visually, in real time:
- Registration status: Instantly see if an extension is online 🟢 or offline 🔴.
- Do Not Disturb (DND) / Call Forwarding (CF): Identify users with DND or CF enabled 🟠.
- Queue Paused State: Spot agents who are paused ⏸️ in their queues.
- Dynamic Member Logins: Did everyone remember to log into their queue today? Now you can see it at a glance. 🔵
Supported Elements
The module isn’t just for inbound routes. It covers the full landscape:
- Inbound Routes
- IVRs
- Queues
- Ring Groups
- Announcements
- Voicemail
- Feature Codes
- Conferences
- DISA
…and more.
Basically, if it’s part of your call flow, you’ll see it represented.
Why This Matters for Admins
If you’re a system administrator or consultant, you already know how much time goes into tracing a single call path. Multiply that across dozens (or hundreds) of routes, and it’s overwhelming.
With Dial Plan Vizualizer, what used to take hours of “guess and test” now takes minutes. You can clearly see the logic, explain it to a client or colleague, and make changes with confidence.
Installation
Installing the Dial Plan Visualizer module is quick and straightforward.
Option 1: Web GUI
- In FreePBX, go to Admin → Module Admin → Upload Module.
- Enter the following URL:
https://github.com/madgen78/dpviz/archive/refs/heads/main.zip - Click Download (From Web).
- Scroll down to Dial Plan Visualizer under the Reports section, and click to expand.
- Click Install, then Process at the bottom of the page to complete the installation.
Option 2: Command Line
For advanced users, you can install directly from the CLI:
cd /var/www/html/admin/modules
fwconsole ma downloadinstall https://github.com/madgen78/dpviz/archive/refs/heads/main.zip
fwconsole reload
For more details and updates, visit the project page: https://github.com/madgen78/dpviz
Wrapping Up
What started as a bare-bones idea has grown into a powerful, practical tool that saves time and reduces frustration.
If you’ve ever asked yourself:
- Where does this call really go?
- What happens if I change this setting?
- Why can’t I just see the whole flow?
…then this module was built for you.
Whether you’re configuring, troubleshooting, or simply exploring, Dial Plan Vizualizer helps you see the invisible—and that makes all the difference.